In some part of the conversation about file servers begins and ends with what capacity they have. And that's ok too, but in this material I wanted to delve far beyond the capacity calculation into a leap in performance.
Okay, but if not just capacity then what else specifically are we going to measure? And here we have to drift aside a bit because there is no such thing as objectively absolute storage performance. What's more, often good performance for one application makes the performance deteriorate for another application. It is also worth quoting the old truth about performance testing that we have three levels of truth. First we have the truth then a lie and finally performance tests. This does not mean, of course, that they are useless, it just means that you need to look very carefully at the results of the tests because they are often conducted under different conditions, on other data, or on other devices. I would like you to take the values given in this material more as a reference to actual ranges than specific values. The differences can be significant and in this material I would like to focus solely on how the performance is affected by the way the drives are configured in the field. But one step at a time.
Storage parameters - throughput
The first of the parameters that determine storage performance is throughput. This is the sequential recording of a continuous stream of data. This is an important parameter when processing backup copies or processing large video files. Keep in mind that the specified parameters will be achieved only with exclusive access to the disk. If another process is using the disk in parallel or we start writing a large number of small files then the performance drops dramatically. For the purposes of this material, we can assume that good disk drives for NAS have a write and read throughput of 200MB/s. I would like to point out that the 200MB/s value refers to either read or write. If we want to perform these operations in parallel the performance will also drop significantly.
Storage parameters - IOPS
The second parameter that determines storage performance is the number of random input/output operations per second, known as IOPS. Most often we have to deal with something like this with many operations on small files, for example, with operations on databases. The measurement should be done either by moving data between different systems to avoid cannibalization of resources and thus interfering with the measurement. You can also use virtual devices, such as sending read data to /dev/null for read tests, then all data is sent "to Berdychev" without worrying about the performance of the target device. In the case of write tests, reading from /dev/zero makes the source data simply zeros.
Storage parameters - latency
The third important parameter to keep in mind when determining the performance of storage is the response time of the disk on demand, known as lethality. It plays a greater role in the case of workloads characterized by a large number of IOPS. This parameter in practice depends on the type of disk drives. For disk drives it is about 15 ms and for SSDs it is about 2 ms. This parameter can not be influenced by the configuration of the field, so I just wanted to talk about it.
Storage parameters - effective capacity
We must also mention that such advantages as redundancy or performance enhancement will most often come at the expense of a reduction in effective disk capacity. That is, the ratio of usable capacity to the total sum of installed disks.
ZFS pool – Key study
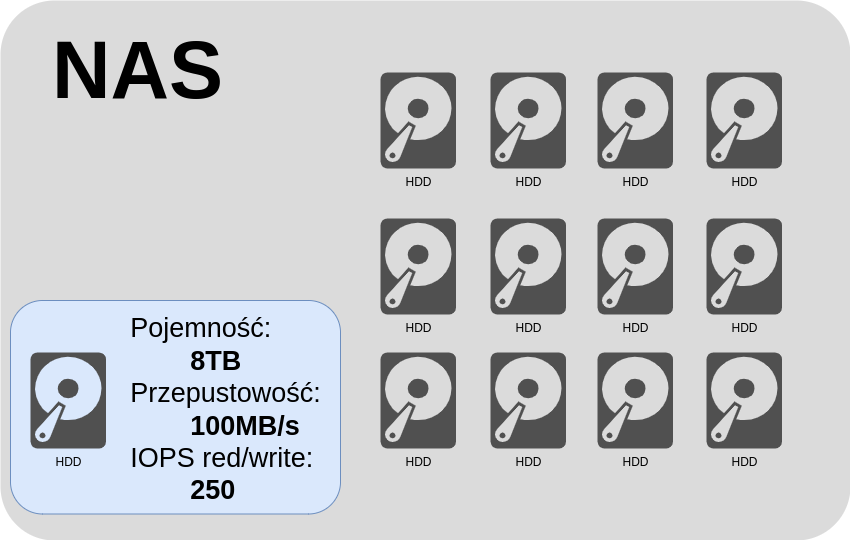
As an example, consider a hypothetical storage consisting of twelve disk drives. Each disk
ZFS pool – Stripe vDev
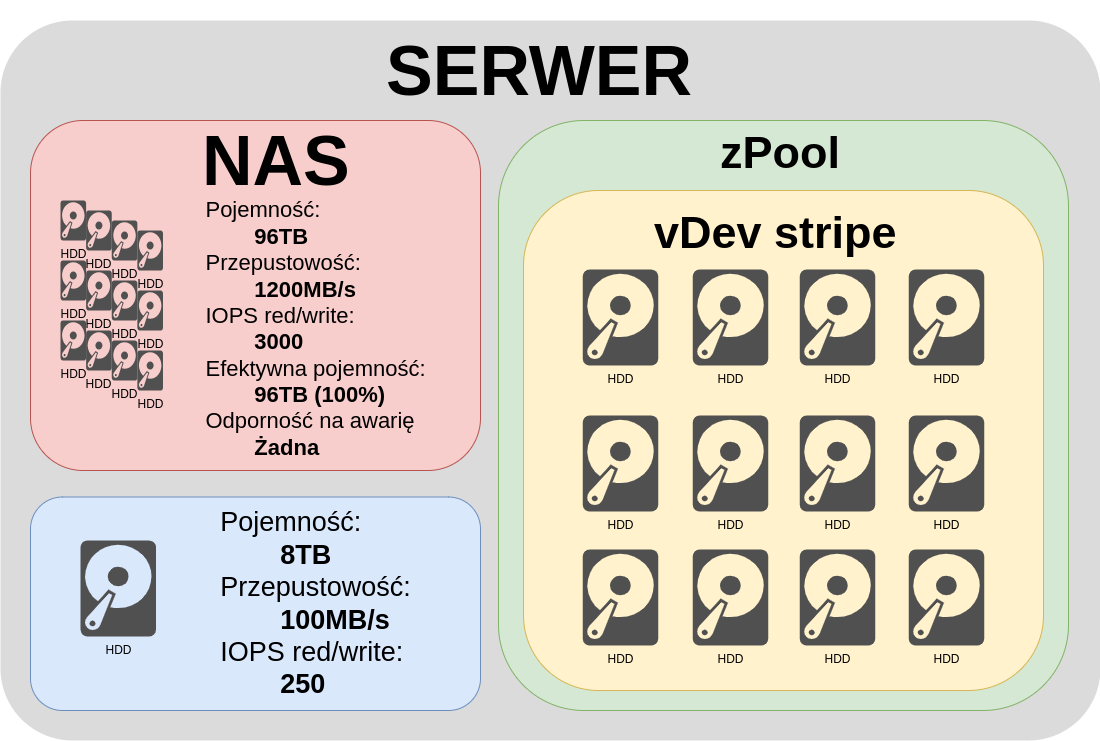
Let's start with the simplest example in which all disks are combined into one vDev stripes. In this case, the data is equally distributed across all the disks. As we can see both capacity and throughput and IOPS, simply multiplied times the number of disks. An ideal situation from a performance perspective, it doesn't get any better. Quite quickly, however, you can see where the trouble is. Failure of any of the disks makes us lose all data, an unacceptable situation.
ZFS pool – Mirror Dev

An extreme case would be if we join all the disks into one vDev mirror. Then we will have the same data stored on each of the disks. The result? An almost absurd resilience to failure of eleven disks. Note, however, what discrepancies are created between read and write both throughput and IOPS. Since there is the same data on all disks, reading can be balanced between disks. Writing no longer, because we have to write the exact same thing to all drives. Of course, both of these examples were extremes unlikely to be useful in practice, but I wanted to briefly show the two extremes of possible solutions. It's time to move on to something more practical.
ZFS Pool – 6x vDev mirror
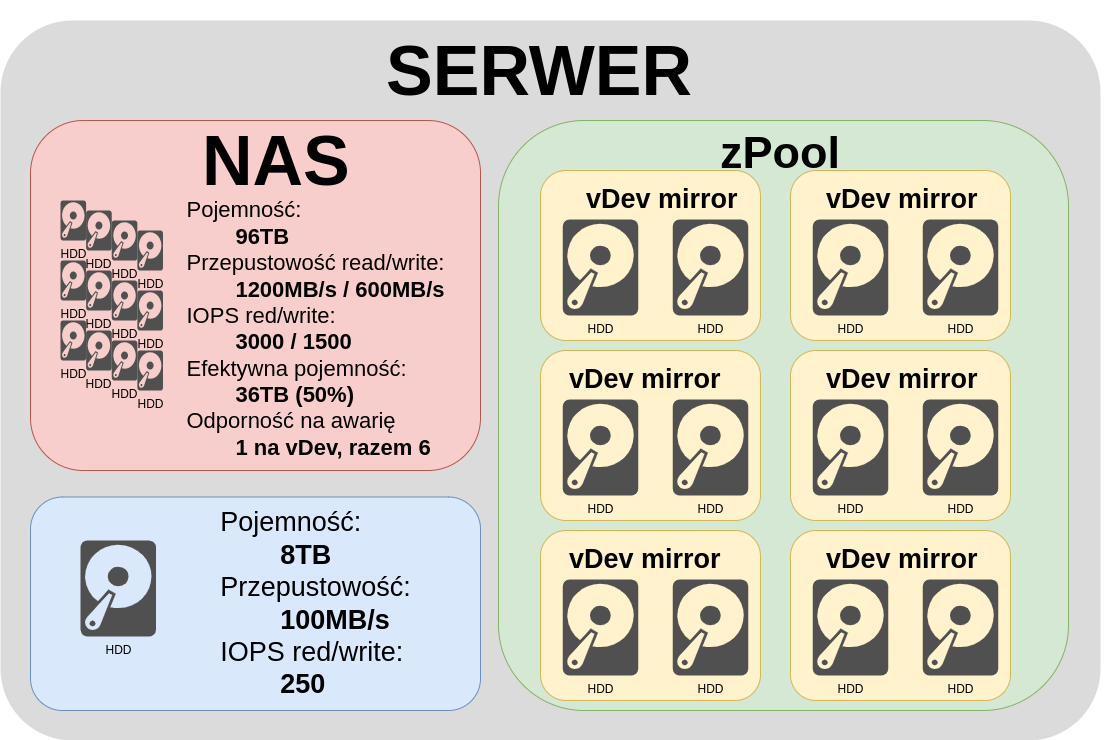
Let's remount our pool this time as six vDevs. Each vDev with two disks in the mirror. In this case, the total read throughput is still the product of the number of reads of a single disk and the number of disks. We have 1200MB/s This is good. Note what happens with the write. The write stream is no longer divided into twelve devices, but into six devices of two each, which gives us 600MB/s. The same IOPS, reading is still possible from all drives in parallel, which gives 3000 IOPS and writing is no longer divided into twelve devices, but into six pairs of two devices, so we have 1500 IOPS. Fault tolerance of one disk in each vDev. It already makes more sense, high speed, high resilience, but effective capacity of well ... 50%. This is already a real-world example used most often if we need the highest possible performance when processing multiple parallel video streams in recording studios, for example.
RAIDz - effective capacity
Let's get to the quintessential ZFS or RAID-Z already. We have three levels of RAID Z1, Z2 and Z3. The number corresponds to the number of disks with checksums, a form of redundancy. That is, RAID Z1 is immune to the failure of one disk Z2 two and, of course, Z3 three. The effective capacity is equal to the number of disks minus the checksum disks. This means in reality slightly less but for the sake of the moment let's simplify that this is the case. Calculating RAIDZ performance can be quite a trap so before we get to calculating RAIDZ performance we need to tell ourselves a bit about how ZFS and in particular RAIDZ works.
RAIDZ - IOPS
If ZFS has to save a data stream to some pool it divides it into data blocks. It distributes these data blocks equally among all its vDevs. These data blocks are split into smaller chunks of data called sectors. Sectors with calculated checksums are added to these sectors and all these sectors are distributed across the disks in a given vDev. Here an important note, ZFS works on blocks of data. Until one block of data, whether written or read, is processed, processing of the next block will not begin. All disks in a given vDev will perform only one operation at a time. The result of this is that, from the point of view of the number of IOPS operations, the entire vDev will be running at the speed of one disk, and the slowest one at that. Let's pause for a moment because this is important in understanding RAIDZ performance. It doesn't matter how many disks a vDev has, whether three or twelve, its performance from an IOPS perspective will be equal to that of a single disk. If we add a second identical vDev to our pool then the performance from an IOPS perspective will double, if we add a third it will be three times that of a single vDev. And so on. The conclusion from this is that when looking for performance in terms of IOPS, we should plan our pool to have more and smaller vDevs rather than one large one.
RAIDZ - throughput
This is how we smoothly pass to the throughput of our RAIDZ. Here the situation is more obvious. The more disks participate in writing or reading, the total write or read is larger. Disks performing the parity function should be subtracted here. That is, one disk for Z1 two for Z2 and three for Z3.
RAIDZ - parameter calculations
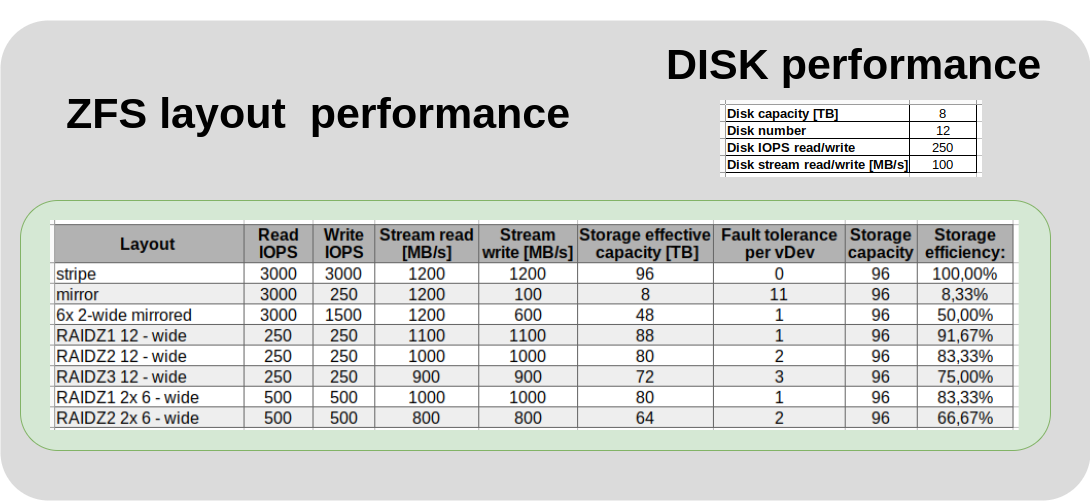
Wanting to create a generalized formula for calculating vdev parameters, we would come to the fact that the number of IOPS of the entire vdev is equal to the number of IOPS of the individual disk. Both for reads and for writes. However, when it comes to the performance of the entire pool, firstly, the IOPS of individual vDev add up, the more vDev the more IOPS. Secondly, what is also worth remembering is that the data in the pool is distributed equally among all vDev in the pool and until all vDevs finish processing data, the next portion of data will not be distributed. The conclusion from this is that if one of our vDevs for some reason has much less IOPS then the other vDevs will level down in speed to the slowest one. Moving on to the comparison, first of all, please remember that the calculations shown in the table are illustrative and are meant to give more of an idea of the mechanisms than the exact results. The table shows different configurations of a combination of twelve identical drives. Presented based on a hypothetical 8TB drive, 250 IOPS and 100MB/s zarwano read and write throughput.
Summary
In a word to sum up this story about leyout ZFS in terms of performance, I wanted to say that I hope I managed to illuminate the way pool scheduling is done and see how much it can make a difference especially in the case of multi-drive storage.
It is important to analyze well what we will keep on our storage before we decide on a particular configuration of our pool. Then everyone will be able to decide on their own, based on their individual needs, what layout will be suitable for them, or just figure out where they went wrong.