Monitoring IT infrastructure with Zabbix – step-by-step installation and initial configuration
Every IT infrastructure—whether it consists of a few servers or an extensive server room with switches, arrays, and multiple services—requires constant monitoring. Monitoring is not only used to respond to failures, but above all to prevent problems before users notice them. One of the most comprehensive and free tools for monitoring IT environments is Zabbix. In this article, we show you what Zabbix is, what its architecture looks like, and how to launch a monitoring system using containers and add the first hosts to it in practice.
Zabbix is enterprise-class software for monitoring IT infrastructure, which allows you to collect data from servers, network devices, operating systems, and applications. All parameters that can be represented numerically can be monitored: CPU load, RAM usage, free disk space, network traffic, temperatures, and even humidity in the server room. The collected data is stored in a database and can be presented in graphs, dashboards, and used to generate alerts.
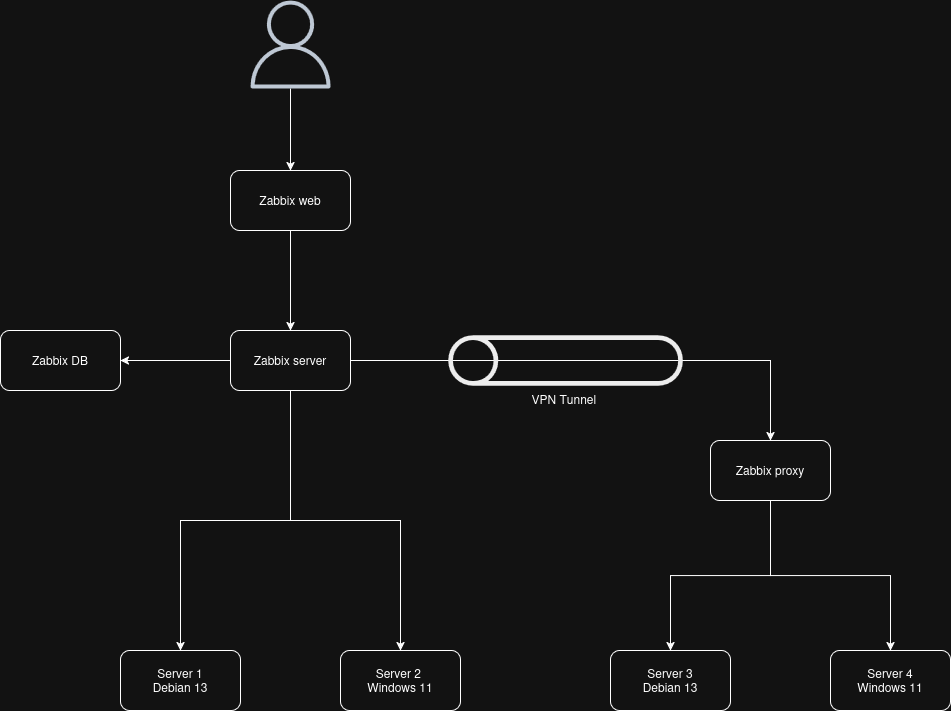
The Zabbix architecture consists of several main components. The user interface is Zabbix Web, a web application accessible via a browser. Zabbix Server runs in the background, responsible for data processing, performing checks, and triggering alarms. A database is required to store information, most often MySQL or PostgreSQL. In distributed environments, Zabbix Proxy can also be used to collect data locally and send it to a central server. A Zabbix agent is installed on monitored machines, or the SNMP protocol is used for network devices.
It is best to start the installation by running Zabbix in Docker. Using Docker Compose allows you to quickly set up the entire infrastructure without manually installing the server, database, and web frontend. Just download the official "zabbix-docker" repository, select the appropriate version (in this case 7.4), and run the containers using a single compose file. The configuration in YAML files allows you to select the database, system image (e.g., Alpine Linux, Ubuntu), server version, and how to run the services. After starting the containers, the system will automatically create a directory structure in which the database data and configuration are stored – these directories must be included in backups, as they contain the entire measurement history and server settings.
An important issue when starting up for the first time is to change the default database and administrator account passwords. Leaving the factory settings in place poses a serious security risk, especially if the interface is accessible from the network. In Docker environment files, you can set your own passwords and usernames before starting the containers, which significantly increases the level of security.
After starting the server, the next step is to install agents on the monitored systems. On Windows, the process is very simple – just download the installer, enter the IP address of the Zabbix server, and complete the installation. During installation, an entry is also created in the system firewall, which allows communication with the agent. It is worth noting that by default this rule is sometimes too broad and it is a good idea to restrict it to the IP address of the monitoring server. On Linux systems, the agent is installed via the package repository. After installation, set the server address in the configuration file, start the service, and set it to start automatically with the system.
On the server side, hosts are configured via the administration panel. Adding a new machine involves creating a host, assigning an IP address, and applying the appropriate template. Templates are at the heart of Zabbix. They contain a set of rules, metrics, graphs, and alarm thresholds that are automatically assigned to a new host. This means that after adding a system to monitoring, the first graphs of CPU, memory, disk space, and network load usage appear within minutes.
Zabbix automatically generates dashboards that clearly display the most important information about the status of your systems. You can view the current server load, detected problems, and trends over time. In addition, a detailed list of recent measurements is available, allowing you to analyze system behavior in detail when troubleshooting failures.
The system also offers a mechanism for automatic detection of resources such as network interfaces and disk partitions. If a new disk or network card appears on the monitored server, Zabbix can add them to monitoring, generate graphs, and configure alerts on its own. This saves a lot of time in larger environments where manual configuration would be inefficient.
It is worth remembering that Zabbix, despite its enormous capabilities, can be a "heavy" tool for the system if configured unwisely. Too many monitored parameters, too frequent checks, and an excess of discovery rules can significantly burden the database and server. Therefore, it is good practice to limit monitoring to metrics that are actually needed and to consciously manage the frequency of data collection.
In summary, Zabbix is a powerful, free, and flexible tool that works well in both small and large IT environments. Thanks to containers, it can be launched in a matter of minutes, and its extensive template library allows key systems to be monitored very quickly. When properly configured, Zabbix not only allows you to respond to failures, but above all to prevent them by providing administrators with a complete picture of the infrastructure's status in real time.
Zabbix Infrastructure
Zabbix server installation
https://www.zabbix.com/documentation/current/en/manual/installation/containers
Download the Zabbix-docekr repository
git clone https://github.com/zabbix/zabbix-docker.git
Switching versions
git checkout 7.4
Start Zabbix server
docker compose -f ./docker-compose_v3_alpine_mysql_latest.yaml up
Download the zabbix-agent repository
Install the Zabbix agent repository
dpkg -i zabbix-release_latest_7.0+debian13_all.deb
We are updating the local repository.
apt update
We install Zabbix agent 2
apt install zabbix-agent2
We are launching the Zabbix service
systemctl restart zabbix-agent2
systemctl enable zabbix-agent2
Folders
zabbix-docker/
├── env_vars – wartości zmiennych i hasła
├── zbx_env – dane aplikacji I bazy danych
└── .env – zmienne całości instalacji